The Distribution Safety Score™ and Safety-Adjusted Yield: How We Grade Income Risk
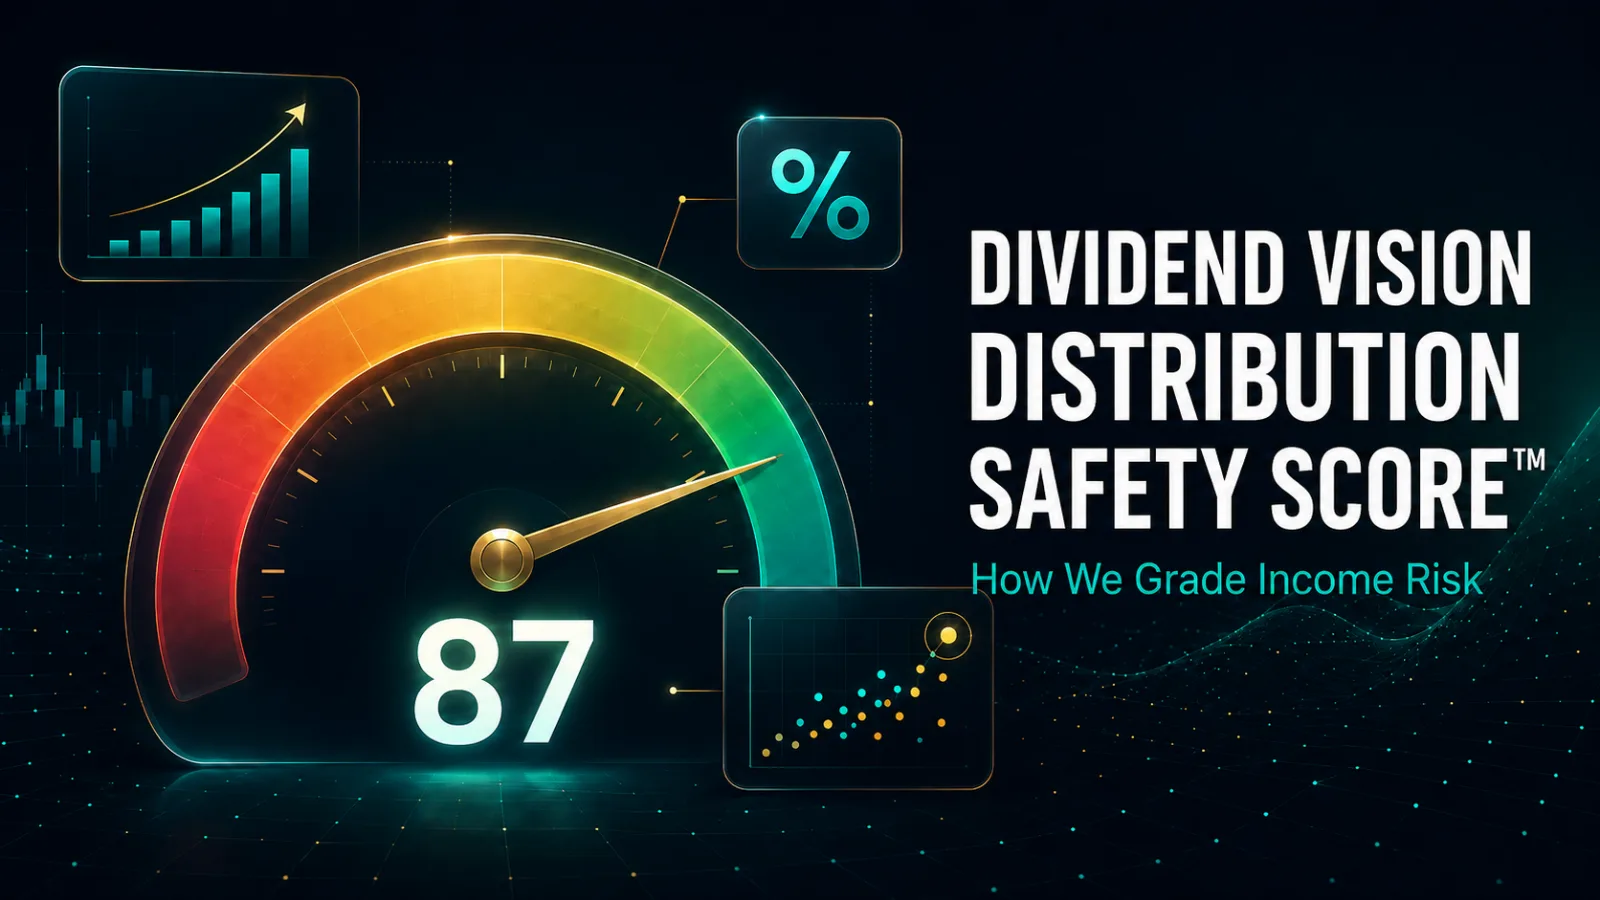
How the Dividend Vision Distribution Safety Score grades payout risk 0–100, and how Safety-Adjusted Yield turns yield and risk into one comparable number.
A 20% yield looks great in a screener — right up until the fund cuts its distribution and the share price follows it down. The hard part of income investing has never been finding yield; it's knowing which yields will still be there next year. That's the problem the Dividend Vision Distribution Safety Score™ is built to solve, and its companion metric — Safety-Adjusted Yield — turns the answer into a single number you can sort by.
What the Distribution Safety Score measures
The Distribution Safety Score grades every covered fund and stock on a 0–100 scale, where higher means safer. It is not an AI black box and not an analyst opinion. It's a transparent, rules-based penalty engine: every ticker starts at 100, and points are deducted only when the data shows a specific, named red flag. On any ticker page you can expand the score card and see exactly what's pulling it down — every deduction is labeled.
The factors it checks include:
- Falling payouts — a shrinking distribution year over year is the single heaviest penalty. A payout that's already being cut is the clearest warning sign there is.
- Past dividend cuts — a cut in the last five years counts against the score even if the payout has since recovered.
- Price erosion and volatility — a fund yielding 12% while its price falls 15% a year is quietly handing your own capital back to you. Twelve-month price decline, drawdown depth, and beta all feed in (with a cap, so market noise alone can't crater the score).
- Yield that outruns its structure — yield level alone is not a defect, but every structure has a plausible ceiling. A covered-call fund can sustainably post yields a plain equity fund can't; the score only penalizes yield above what the fund's design can credibly support.
- Leverage, concentration, and crypto exposure — structural risk amplifiers that make any payout stream more fragile.
- Missed, skipped, or irregular distributions — a payer that has gone quiet, or one with no stated schedule and a sporadic history, is flagged directly. Irregular payers don't get a Safety-Adjusted Yield at all, because their posted rate isn't a dependable forward number.
- Thin coverage, small size, and high fees — payout ratios above 100%, tiny asset bases, and expense drag round out the picture.
Scores map to five plain-English bands:
| Score | Band |
|---|---|
| 80–100 | Safe |
| 60–79 | Generally safe |
| 40–59 | Caution |
| 20–39 | Elevated risk |
| 0–19 | High risk |
Two honest limitations are built in. Funds without enough payout history are marked Unproven and capped at 50 — a fund that launched six months ago hasn't earned a "Safe" badge no matter how good it looks. And when key inputs are missing, the score carries a confidence flag and is capped rather than pretending to certainty it doesn't have.
Safety-Adjusted Yield: risk and reward in one number
Yield tells you what a fund promises. The safety score tells you how likely it is to deliver. Safety-Adjusted Yield multiplies the two:
Safety-Adjusted Yield = distribution rate × (Distribution Safety Score ÷ 100)
A 10% yield backed by a score of 80 becomes 8.0%. A 20% yield backed by a score of 30 becomes just 6.0%. Safety-Adjusted Yield isn't a forecast of your return; it's a discount on the headline number sized to the evidence of risk, so a screener sorted by it surfaces yields that are both large and likely to persist.
That's the theory. Here's what it does to real funds.
The case, in four real examples
Scores and yields below are from our July 2026 daily build; they refresh every day, so the live numbers on the site may differ slightly.
1. The 81% yield that ranks below a 25% yield
MSTY, the YieldMax MSTR option income fund, posts a headline distribution rate around 80.8% — the kind of number that dominates any raw-yield leaderboard. But single-stock concentration on a crypto-linked underlying plus heavy price erosion drop its score to 24 (Elevated risk), so its Safety-Adjusted Yield is 19.4%.
FEPI, a diversified tech covered-call fund, yields 24.9% — less than a third of MSTY's headline. Its score of 83 (Safe) leaves a Safety-Adjusted Yield of 20.7%.
Sorted by raw yield, MSTY beats FEPI by 56 points. Sorted by Safety-Adjusted Yield, FEPI wins. One number captured what a yield column never could: how much of that 81% you should actually expect to keep collecting.
2. Same headline yield, three different risk profiles
The Global X covered-call trio all post essentially the same yield — about 12%:
| Fund | Yield | Score | Safety-Adjusted Yield |
|---|---|---|---|
| QYLD | 12.0% | 87 — Safe | 10.4% |
| XYLD | 12.0% | 81 — Safe | 9.7% |
| RYLD | 12.0% | 74 — Generally safe | 8.9% |
A yield sort calls these funds identical. They aren't: RYLD's small-cap underlying has suffered deeper price erosion, and the score registers it. If you're choosing one of the three for income, the tiebreaker is sitting right there.
3. High yield does not automatically mean low score
The model doesn't punish big numbers — it punishes evidence of fragility. Plenty of double-digit yielders keep strong scores because the payouts are steady, coverage is real, and the price isn't melting:
A 20% yield with a 97 score keeps a Safety-Adjusted Yield of 20.1% — nearly the full headline. The discount only bites when the data says it should.
4. And a safe 3% is still a 3%
At the other end, SCHD scores a perfect 100 on a 3.1% yield — Safety-Adjusted Yield 3.1%. The metric doesn't inflate safe funds; it just refuses to discount them. Whether a durable 3% beats a risk-adjusted 19% is your call and depends on your goals — but now the two are finally on the same scale.
Where to find both metrics
- Every ticker page shows the score as a gauge with its band, the factor-by-factor breakdown, and the Safety-Adjusted Yield beneath it.
- The screener offers both as sortable, range-filterable columns — try sorting by Safety-Adjusted Yield instead of raw yield and watch the leaderboard change.
- The Risk vs. Reward scatter chart plots distribution rate against the score, with the best safety-adjusted yielders highlighted — the funds in the upper-right are the ones earning their yield.
For the full methodology, see How the Distribution Safety Score works and Safety-Adjusted Yield explained.
Educational content, not investment advice. The Distribution Safety Score and Safety-Adjusted Yield are data-driven risk indicators, not predictions or recommendations. Scores and yields shown are point-in-time examples and change with each daily data refresh. Always do your own research before investing.