5 Dividend ETFs That Beat SCHD in Total Return
SCHD is the default dividend ETF for many investors, but these five funds beat its five-year total return. Here is how—and what you give up in exchange.
The Schwab U.S. Dividend Equity ETF (SCHD) has become the default answer in many dividend-investing circles. It is inexpensive, produces an attractive yield, and owns established companies selected using dividend quality and financial-strength screens.
But "popular" and "highest-performing" are not the same thing.
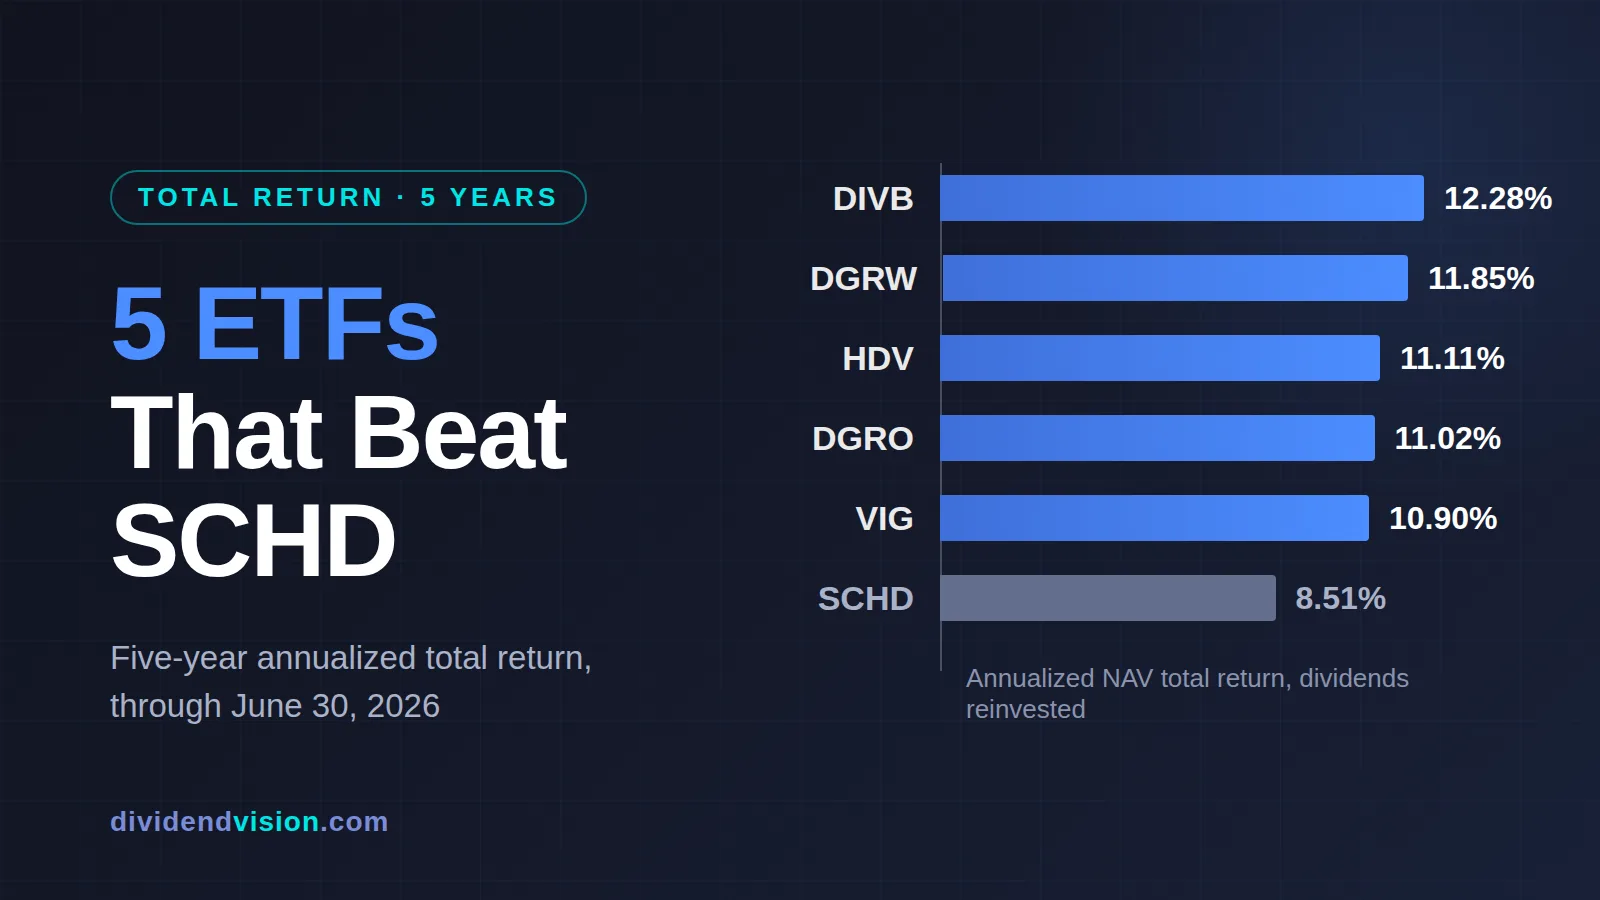
For the five years ended June 30, 2026, SCHD generated an average annual total return of 8.51% at net asset value. That is respectable, but several dividend-oriented ETFs delivered meaningfully stronger results over the same period.
The five funds below did not beat SCHD by abandoning dividends. Each still emphasizes dividends, dividend growth, or capital returned to shareholders. What changed was the balance between current income and future growth.
The Five-Year Results
| ETF | 5-Yr Annualized Total Return | Edge Over SCHD | Value of $10,000 | 30-Day SEC Yield | Expense Ratio |
|---|---|---|---|---|---|
| DIVB | 12.28% | +3.77% | $17,845 | 2.71% | 0.05% |
| DGRW | 11.85% | +3.34% | $17,506 | 1.22% | 0.28% |
| HDV | 11.11% | +2.60% | $16,934 | 3.14% | 0.08% |
| DGRO | 11.02% | +2.51% | $16,866 | 1.98% | 0.08% |
| VIG | 10.90% | +2.39% | $16,775 | 1.56% | 0.04% |
| SCHD | 8.51% | — | $15,043 | 3.34% | 0.06% |
Performance figures are average annual NAV total returns for the five years ended June 30, 2026. The hypothetical account values were calculated by compounding the reported annualized returns and assume distributions were reinvested. Yields are the latest 30-day SEC yields published by the fund sponsors around June and July 2026 and will fluctuate.
1. iShares Core Dividend ETF — DIVB
Five-year annualized total return: 12.28%
DIVB produced the highest five-year return in this group, beating SCHD by 3.77 percentage points per year.
That difference added up quickly. Based on the reported annualized returns, a hypothetical $10,000 investment would have grown to approximately $17,845 in DIVB, compared with about $15,043 in SCHD—a difference of roughly $2,800.
DIVB takes a broader view of shareholder distributions than a traditional dividend ETF. It tracks the Morningstar US Dividend and Buyback Index, which includes companies with a history of paying dividends, repurchasing shares, or doing both. The portfolio held 382 securities as of July 15, 2026, and charged an expense ratio of only 0.05%.
The buyback component is important. A company can return capital by paying cash dividends, repurchasing its shares, or combining the two. By recognizing both forms, DIVB can own profitable companies that return substantial capital but do not necessarily offer an SCHD-sized dividend yield.
The tradeoff is income. DIVB's latest 30-day SEC yield was 2.71%, below SCHD's 3.34%. Investors received less immediate cash flow, but over this five-year window, stronger capital appreciation more than compensated for the difference.
DIVB may appeal most to investors who want a low-cost dividend strategy but are willing to count share repurchases as part of the shareholder-return equation.
2. WisdomTree U.S. Quality Dividend Growth Fund — DGRW
Five-year annualized total return: 11.85%
DGRW focuses less on finding the market's highest yields and more on finding dividend-paying companies with attractive quality and growth characteristics.
WisdomTree describes the fund as a portfolio of U.S. large-cap dividend payers selected using quality and growth screens. DGRW returned 11.85% annually over the five years ended June 30, 2026, versus SCHD's 8.51%.
That approach helped DGRW participate more fully in the growth of highly profitable companies. It also explains why DGRW should not be treated as a direct SCHD clone. Its latest 30-day SEC yield was only 1.22%, while its 0.28% expense ratio was the highest among the funds in this comparison.
In other words, DGRW asks investors to accept a much smaller starting yield and a higher fee in exchange for greater emphasis on earnings growth, profitability, and long-term capital appreciation.
Over the latest five-year period, that trade worked. Approximately $10,000 compounded at DGRW's reported return would have grown to about $17,506—roughly $2,460 more than the same amount compounding at SCHD's return.
DGRW may be better suited to investors still accumulating wealth than to retirees who need maximum portfolio income today. It is a dividend-growth fund with the emphasis firmly on growth.
3. iShares Core High Dividend ETF — HDV
Five-year annualized total return: 11.11%
HDV is the most direct high-income competitor on this list.
Its latest 30-day SEC yield was 3.14%, just below SCHD's 3.34%. Yet HDV delivered an 11.11% annualized five-year total return, beating SCHD by 2.60 percentage points per year.
The fund tracks the Morningstar Dividend Yield Focus Index and held 75 securities as of July 15, 2026. Its portfolio was heavily weighted toward consumer staples, health care, and energy, with those three sectors representing more than two-thirds of assets at that time.
That concentration can be both a feature and a risk. HDV may perform well when defensive businesses, energy companies, and high-quality income stocks are leading the market. It may lag when technology and more growth-oriented sectors dominate.
There is another important wrinkle: HDV's five-year victory did not extend to the full 10-year period. Its 10-year annualized return was 9.11% through June 30, 2026, compared with 12.37% for SCHD.
HDV therefore demonstrates why investors should never crown a permanent winner based on one trailing period. It was the closest match for SCHD's current income in this group, but its more concentrated portfolio and weaker 10-year history deserve attention.
4. iShares Core Dividend Growth ETF — DGRO
Five-year annualized total return: 11.02%
DGRO offers a broad, low-cost approach to dividend growth.
The fund held approximately 390 stocks as of July 15, 2026, and tracks an index of U.S. companies with a history of growing their dividends. Its expense ratio was 0.08%, while its latest 30-day SEC yield was 1.98%.
Unlike SCHD, DGRO is not trying to maximize starting yield. Its portfolio spreads assets across hundreds of companies and places more emphasis on the ability to increase distributions over time.
That distinction helped DGRO generate an 11.02% annualized total return over the five years ended June 30, 2026. A hypothetical $10,000 investment compounding at that rate would have reached approximately $16,866, or about $1,820 more than the corresponding SCHD calculation.
DGRO also held up well over a longer measurement period. Its 10-year annualized return was 13.38%, compared with 12.37% for SCHD.
For an investor who wants dividend growth, broad diversification, and a moderate fee, DGRO may offer one of the most balanced alternatives. The obvious sacrifice is current income: its SEC yield was more than a full percentage point below SCHD's.
5. Vanguard Dividend Appreciation ETF — VIG
Five-year annualized total return: 10.90%
VIG is built around one of the strictest dividend-growth philosophies in the ETF market.
The fund tracks the S&P U.S. Dividend Growers Index. To qualify, a company generally must have increased its dividend every year for at least 10 consecutive years. The index also excludes the highest-yielding 25% of otherwise eligible companies, a rule designed to keep the portfolio from simply loading up on unusually high yields.
That exclusion is a clue to how VIG approaches dividends: it prioritizes consistency and durability, not maximum income.
VIG returned 10.90% annually over the five years ended June 30, 2026. It also carried the lowest expense ratio in this comparison at 0.04%, although its latest 30-day SEC yield was only 1.56%.
A hypothetical $10,000 investment compounding at the reported five-year rate would have grown to approximately $16,775. That is about $1,730 more than the SCHD result, despite VIG producing less than half as much current yield.
VIG may appeal to investors who view a steadily rising dividend as evidence of corporate quality but do not need a large amount of income immediately. Its low fee also makes it an attractive long-term core holding.
Why Did These ETFs Beat SCHD?
The common thread is not complicated: most of these funds accepted a lower starting yield in exchange for more exposure to dividend growth, quality growth, or broader shareholder returns.
SCHD's latest 3.34% SEC yield was higher than the corresponding yield for every ETF in this comparison, including HDV. Its 0.06% expense ratio was also extremely competitive. SCHD did not suddenly become a bad fund; it simply pursued a different balance between income, valuation, and growth.
Funds such as DGRW and VIG placed more emphasis on profitable companies capable of compounding earnings. DGRO spread its assets across a much broader dividend-growth portfolio. DIVB counted buybacks as another form of capital return. HDV used a concentrated high-yield strategy that benefited from a different sector mix.
The inference is straightforward: during this particular five-year window, those approaches produced more capital appreciation than SCHD's higher starting income could offset.
Where Do SPYI, QQQI, and TSPY Fit In?
Some readers will notice a whole category missing from this list: the newer options-based income ETFs that dominate dividend-investing conversations today, such as NEOS's SPYI and QQQI or TappAlpha's TSPY.
Their absence is deliberate, and the reason matters. This comparison requires five full years of NAV total-return history, and none of those funds is old enough to qualify. SPYI launched in August 2022, QQQI in January 2024, and TSPY in August 2024. There is simply no five-year record to measure against SCHD—in either direction.
These funds also play a different game. They sell options against an equity index to convert potential price appreciation into large monthly distributions, which makes them income tools first and total-return vehicles second. Comparing a covered-call fund's first eighteen months against SCHD's established track record would tell you almost nothing about how it will behave across a full market cycle—including a prolonged drawdown, which is where options-income strategies face their sternest test.
That is not a criticism. It is a reminder that a fund cannot be judged on a window it has not lived through. As SPYI approaches its five-year mark, it will be fair to run this exact comparison—and we will.
Before You Replace SCHD, Check the Time Frame
Trailing returns are useful, but they are also extremely sensitive to their starting and ending dates.
For example, SCHD's one-year NAV return through June 30, 2026, was 24.08%. That was ahead of DGRW, HDV, DGRO, and VIG over the same one-year period; only DIVB, at 25.52%, finished higher.
The 10-year comparison also produced a mixed result. DGRW returned 13.96% annually, DGRO returned 13.38%, and VIG returned 13.13%, all ahead of SCHD's 12.37%. HDV, however, returned only 9.11%, while DIVB did not yet have a 10-year record because it launched in November 2017.
That is why yesterday's leaderboard should not become tomorrow's shopping list. Performance-chasing is still performance-chasing, even when the funds have reassuring words such as "dividend" and "quality" in their names.
The Bottom Line
Five dividend-oriented ETFs beat SCHD's total return over the five years ended June 30, 2026:
- DIVB delivered the strongest return by combining dividends with share buybacks.
- DGRW leaned aggressively into profitable dividend growers.
- HDV came closest to matching SCHD's current yield.
- DGRO offered broad diversification and a solid long-term record.
- VIG paired strict dividend-growth requirements with an exceptionally low expense ratio.
None is automatically superior to SCHD.
For an investor prioritizing income today, SCHD's higher current yield may still be more valuable than an extra few percentage points of historical capital appreciation. For someone with a long accumulation runway, the lower-yielding growth strategies may have more appeal. And for many portfolios, one of these ETFs may work better as a complement to SCHD than as a complete replacement.
The real lesson is not that SCHD has been dethroned. It is that dividend yield and total return are not interchangeable. A bigger distribution can feel rewarding every quarter, but what ultimately matters is how much the entire investment—income plus price appreciation—compounds over time.
This article is for educational purposes only and does not constitute individualized investment, tax, or financial advice. ETF prices, distributions, yields, holdings, and expenses can change. Past performance does not guarantee future results.