Why Your Fund’s Yield Isn’t Telling the Whole Story: 5 Takeaways for Smarter Investing
To the untrained eye, a 91% yield looks like a once-in-a-lifetime gold mine. To the yield-chaser, it looks like a retirement plan. To a seasoned investment strategist, it looks like a flashing red siren.
As we navigate the market landscape of 2026, many investors are still reeling from the confusion of the Fed’s recent tightening cycles and the explosion of "income-enhanced" derivative funds. You open a fund profile and see three wildly different percentages: an SEC Yield of 2.5%, a Distribution Yield of 91%, and a 12-Month Trailing Yield of 15%.
These numbers aren't typos. They are different camera lenses viewing the same subject, and if you don’t know which lens you’re looking through, you’re essentially flying blind. Let’s demystify the numbers and look at what is actually happening under the hood of your portfolio.
1. The SEC Yield: Your Only “Apples-to-Apples” Benchmark
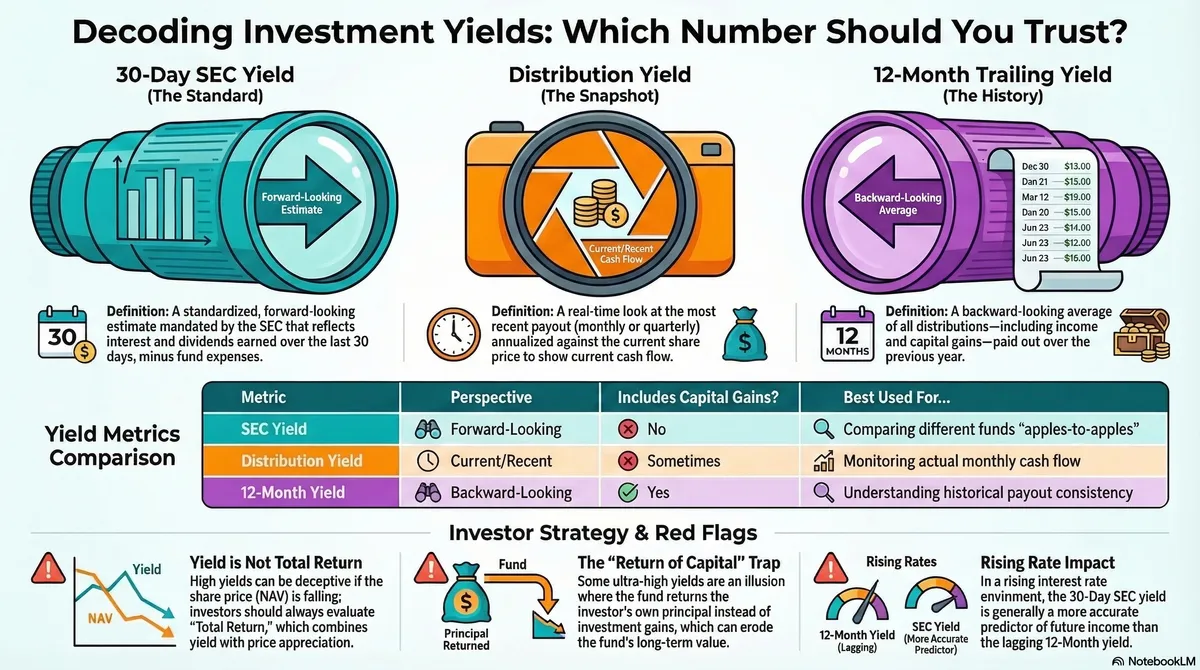
If you want the most honest, "no-nonsense" metric, the 30-Day SEC Yield is the gold standard. Mandated by the SEC to prevent predatory marketing, this is the only yield that is standardized across the industry.
Think of the SEC yield as the Yield-to-Maturity (YTM) for a bond fund. It is a forward-looking estimate of the income you can expect over the next year, assuming all underlying bonds are held to maturity and income is reinvested. Crucially, it reflects income after deducting fund expenses.
"The SEC yield, also referred to as the standardized yield, is a computation that allows comparison of bond funds that fall under the jurisdiction of the Securities and Exchange Commission... It allows investors to make comparisons between funds easily." — Corporate Finance Institute
Strategist’s Perspective: Because it removes the "noise" of one-time capital gains and special distributions, the SEC yield is the only way to compare a Vanguard fund to a BlackRock fund fairly. It tells you what the fund is earning, not just what it chooses to pay.
2. The Distribution Yield: Welcome to the Wild West
While the SEC yield tells you what the fund earns, the Distribution Yield tells you what the fund is currently paying. It’s a snapshot of the most recent cash flow hitting your account.
The Snapshot Formula: Distribution Yield = (Most Recent Distribution × 12) ÷ Current Share Price
The appeal is the immediate cash flow. However, unlike the SEC yield, this metric is the "Wild West." There is zero standardization. For example, Vanguard typically calculates this based on the most recent monthly distribution, while Fidelity may look at the last 12 months.
The Hidden Warning: If the distribution yield is significantly higher than the SEC yield, the fund likely holds bonds trading at a premium (above par). This means you are receiving higher coupon payments now, but a price drop is "baked in" as those bonds approach maturity. You aren't getting a "free lunch"; you're simply consuming your principal in advance.
3. The 12-Month Yield: Driving by the Rearview Mirror
The 12-Month Yield (or Trailing Yield) is a backward-looking average of all payouts over the last year. While it provides a full-year history, it is a dangerous metric in a changing rate environment.
We saw this clearly during the Fed’s aggressive tightening cycle. If interest rates shifted six months ago, last year’s yield is a meaningless figure for a new investor today. Relying on this is like trying to drive a car while looking only at the rearview mirror—it tells you where you’ve been, but offers no warning about the cliff edge directly in front of you.
4. The Yield vs. Total Return Trap
The greatest mental trap for retail investors is prioritizing yield over Total Return. Yield is just one component of wealth; the other is the movement of the fund's price (NAV). A high yield is deceptively comforting if the underlying price is eroding.
| Focus Area | The Tangible Goal | The Hidden Catch |
|---|---|---|
| Yield Focus | Current Cash Flow: The "feel-good" check in the mail. | Principal Erosion: You might receive 7% while your principal drops 10% (NAV decay). |
| Total Return Focus | Long-term Health: Price Appreciation + Income. | Psychological Barrier: It’s harder to "spend" a gain that isn't a physical check. |
5. The "Return of Capital" Illusion: Handing Back Your Own $10 Bill
The most provocative development in recent years is the rise of derivative-income funds like TSLY or JEPI. These funds act as "insurance sellers," collecting premiums by selling options. When volatility spikes, they can look like heroes; when the market runs away from them, they are exposed to the full cost of the event.
The real danger here is the Return of Capital (ROC) phenomenon. In many high-yield derivative funds, the "yield" is a powerful illusion created by handing you back your own principal.
The 2025/2026 Case Study: In November 2025, YieldMax’s TSLY reported a staggering ~91% annualized distribution rate. However, its SEC yield was a mere ~2.5%. Issuer filings revealed that 98% of that massive distribution was classified as Return of Capital.
To demystify this: the fund was effectively handing you back your own $10 bill and calling it a $10 profit. In a down market, this "income" locks in losses and steadily erodes the fund’s NAV. It isn't wealth creation; it’s a systematic liquidation of your own account.
Quick Reference: Which Metric for Which Goal?
- For Future Income Planning: Use SEC Yield. It is the most accurate, standardized, forward-looking view of earning power. Tools like our ETF Screener let you filter and sort by SEC yield to find funds with genuine earning power.
- For Monthly Cash Flow Tracking: Use Distribution Yield. This tells you what is hitting your account today, but beware of "Wild West" calculation differences. Explore our monthly and weekly income ETF lists to find funds that match your cash-flow needs.
- For Historical Performance: Use 12-Month Yield. Useful for seeing the full-year story of past stability.
- For Reality Testing: Use Total Return. This combines yield with price changes to show if you are actually getting richer or just spending your principal.
Conclusion: Looking Beyond the Percentage
Yields are not a single truth; they are different perspectives. As you build your portfolio for the remainder of 2026, ask yourself a provocative question: Are you chasing a headline yield at the expense of your total wealth?
A high yield is often the market’s way of compensating you for a falling price or an unsustainable strategy. Don’t be seduced by the "insurance sellers" of the derivative world without checking the SEC yield first. If the two numbers don’t speak the same language, the "income" you’re celebrating might just be your own money being returned to you—one $10 bill at a time.
Keep Exploring
- ETF Screener — Filter funds by yield, distribution frequency, and more
- ETF Comparator — Compare yield metrics side by side
- Unlocking the VistaShares Target 15 ETFs — See how a 15% yield target actually works under the hood
- Tax-Loss Harvesting Guide — Year-end strategies for managing gains and losses
- Dividend Aristocrats: Surprising Truths — Why consistent growth beats high yield
- Income Goal Calculator — Plan how much you need to invest for your target monthly income