Alternatives
Best JEPQ Alternatives in 2026
Top Nasdaq-100 income and covered-call ETFs to consider alongside or instead of JPMorgan Nasdaq Equity Premium Income (JEPQ).
Data updated September 2026 · 12 ETFs
Who this page is for
Best for
- JEPQ holders who want a higher yield or a more tax-efficient distribution on the same Nasdaq exposure
- Income investors diversifying across Nasdaq-100 covered-call methodologies
- Anyone comparing monthly Nasdaq income ETFs before adding new money
Not a fit for
- Investors who want uncapped Nasdaq upside — every fund here trades gains for premium
- Those seeking broad diversification — all are concentrated in the same megacap tech names
- Bull-market maximalists; covered-call income lags a fast-rising Nasdaq
Analysis
Category overview: This group of 12 ETFs represents alternatives to JEPQ, all pursuing income through options-based or covered call strategies on tech-heavy or Nasdaq-linked indexes. The category averages a 14.20% yield and a 0.60% expense ratio, with JPMorgan anchoring the space through both JEPI and ROCQ, while newer entrants like NEOS, Roundhill, REX Shares, and TappAlpha have introduced weekly-distribution and 0DTE options strategies that push yields notably higher. Distribution frequency splits between Monthly and Weekly, with the weekly-pay funds (QDTE, FEPI) generally showing among the highest yields and expense ratios in the top 10 shown.
AI-generated analysis — AI can make mistakes. Verify important information independently. Not investment advice. AI risk disclosure
Risks specific to this category
- Strategy mismatch: several funds on this list track a different index or use a different income mechanism than JEPQ, so swapping into one changes the exposure — upside participation, payout cadence, and tax character can all shift, not just the ticker.
- Capped upside: covered-call and option-overlay funds in this group keep the option premium in a rally but surrender gains above the strike, so they can trail the very index they write options against.
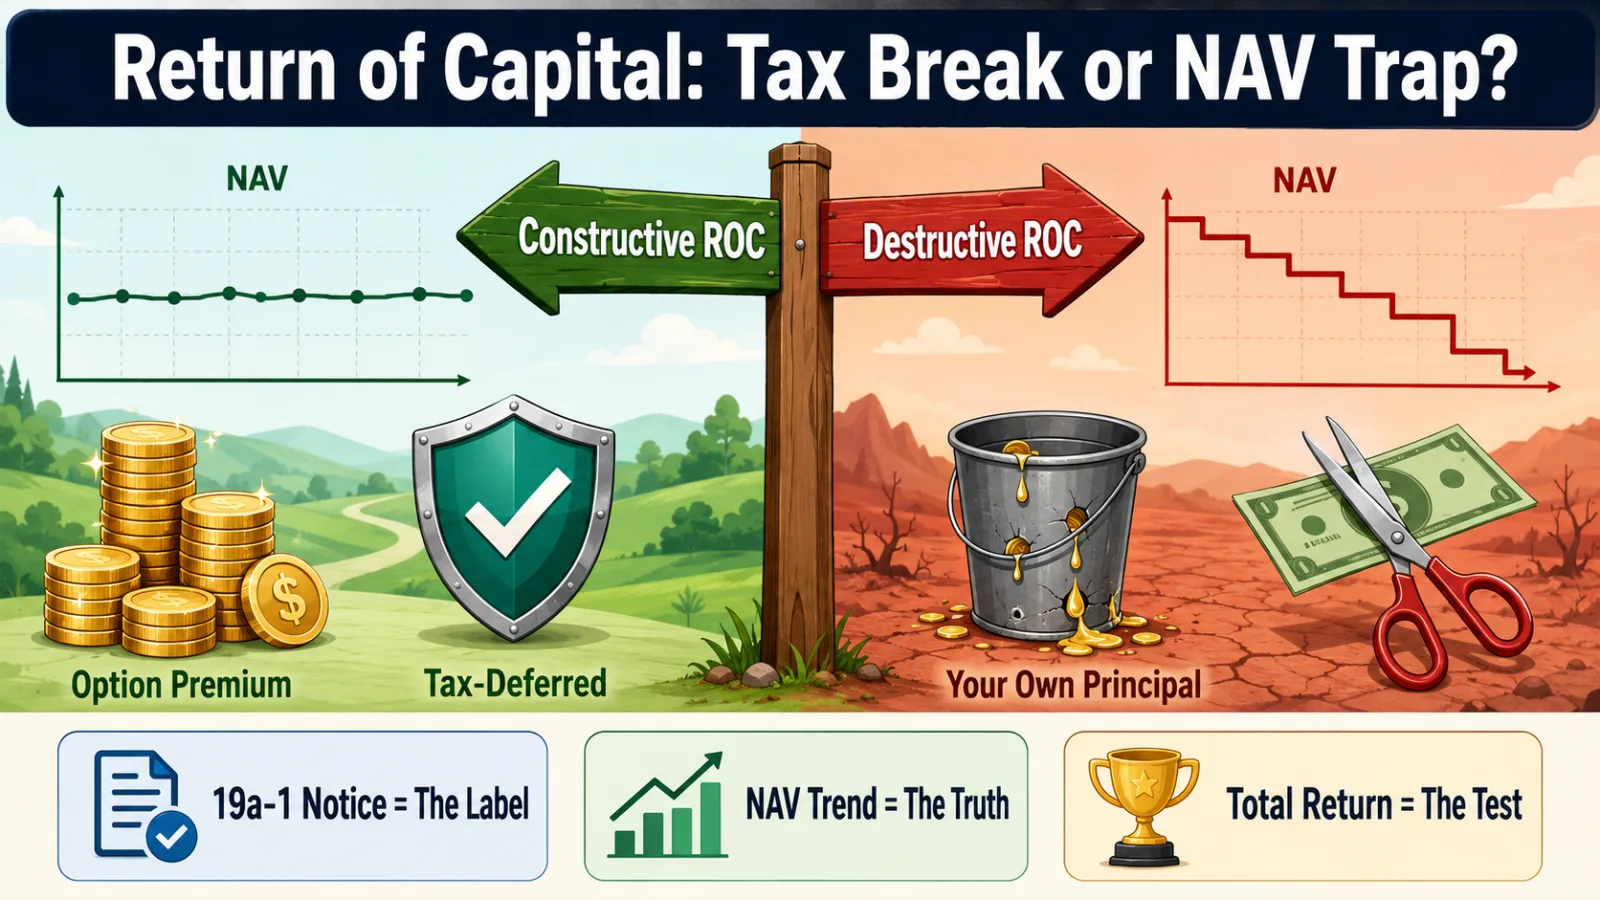
- Distribution sustainability: the average distribution rate here is 14.2%, and payouts at that level often include return of capital — when distributions persistently exceed total return, NAV erodes and shrinks the base that generates future income.
- Single-index dependence: most funds here are built on the same Nasdaq-100 exposure, so they rise and fall together and share that index's concentration in its largest constituents — holding several of them does not diversify the underlying index risk.
- Expense drag: expense ratios in this group average 0.60% — several times what broad index funds charge — and that cost compounds directly against total return.
See this list inside your portfolio
A ranked list is a starting point. Dividend Vision turns it into a plan — forecasting the income your holdings actually generate and putting each fund's yield next to its total return and risk.
- Income forecasting — know what your holdings pay monthly, quarterly, and yearly
- Yield vs. total return — weigh each distribution against price performance, not the headline rate
- Screen & compare — line up any income ETFs side by side on yield, cost, and strategy
- Portfolio risk — see income concentration, issuer overlap, and volatility across your holdings
- AI ETF comparison — ask plain-language questions to compare yield, risk, and income potential
7 days of Pro included · no credit card · free plan afterward
How these alternatives are selected
- Universe: a hand-curated peer set, split into close peers (9 here — same core exposure and same income mechanism, so a like-for-like swap) and broader substitutes (a different index, underlying asset, or income mechanism). Every fund is labelled in the Strategy fit column; JEPQ itself is excluded.
- Eligibility: active ETFs only — liquidated, delisted, and renamed funds drop out automatically. Leveraged and inverse products are never listed: a daily-reset 2x or -1x fund is not an alternative to a long income position.
- Ranking: assets under management, used only as a fund-size ranking. Never ranked by yield — yields are shown as data, not used to order the list.
- Fit: how each fund's strategy differs from JEPQ — and who each one suits — is covered in the strategy notes and FAQ below.
Top picks
Top 3 JEPQ alternatives by assets under management.
Yield distribution
Expense ratio distribution
Income projection
Estimated income if the current average distribution rate of 14.20% held for a full year with share prices unchanged. Distribution rate is not total return—a fund can pay a large distribution while its share price falls—so treat these as an upper-bound illustration, not a forecast.
| Investment | Annual income | Monthly income | Weekly income |
|---|---|---|---|
| $10,000 | $1,420 | $118 | $27 |
| $25,000 | $3,551 | $296 | $68 |
| $50,000 | $7,102 | $592 | $137 |
| $100,000 | $14,203 | $1,184 | $273 |
Issuer breakdown
Distribution of ETFs by fund issuer, showing how concentrated or varied the sponsor lineup is.
All 12 ETFs
| Ticker | Name | Strategy fit | Issuer | Yield | Expense ratio | AUM | Frequency |
|---|---|---|---|---|---|---|---|
| JEPI | JPMorgan Equity Premium Income ETF | Broader substitute | JPMorgan | 7.93% | 0.35% | $45.3B | Monthly |
| QQQI | NEOS Nasdaq-100 High Income ETF | Close peer | NEOS | 13.99% | 0.68% | $14.5B | Monthly |
| QYLD | Global X Nasdaq 100 Covered Call ETF | Close peer | Global X | 11.83% | 0.60% | $8.3B | Monthly |
| GPIQ | Goldman Sachs Nasdaq-100 Core Premium Income ETF | Close peer | Goldman Sachs | 10.48% | 0.29% | $5.7B | Monthly |
| QDTE | Roundhill Innovation-100 0DTE Covered Call Strategy ETF | Close peer | Roundhill Investments | 20.76% | 0.96% | $946M | Weekly |
| QDVO | Amplify CWP Growth & Income ETF | Broader substitute | Amplify ETFs | 10.88% | 0.56% | $762M | Monthly |
| FEPI | REX FANG & Innovation Equity Premium Income ETF | Broader substitute | REX Shares | 24.85% | 0.65% | $695M | Weekly |
| ROCQ | JPMorgan Nasdaq Equity Premium Yield ETF | Close peer | JPMorgan | 10.59% | 0.35% | $629M | Monthly |
| IQQQ | ProShares Nasdaq-100 High Income ETF | Close peer | ProShares | 5.69% | 0.55% | $398M | Monthly |
| TDAQ | TappAlpha Innovation 100 Growth & Daily Income ETF | Close peer | TappAlpha | 17.12% | 0.83% | $364M | Monthly |
| QQQY | Defiance Nasdaq 100 Enhanced Income ETF | Close peer | Defiance ETFs | 29.47% | 1.01% | $185M | Weekly |
| QYLG | Global X Nasdaq 100® Covered Call & Growth ETF | Close peer | Global X | 6.85% | 0.35% | $172M | Monthly |
Frequently asked questions
What are the best jepq alternatives?
This page lists the top 12 ETFs in this category ranked by key metrics. The list includes funds from issuers like JPMorgan, NEOS, Global X, Goldman Sachs, Roundhill Investments and more.
How often is this list updated?
The data on this page is refreshed regularly using the latest available distribution rates, expense ratios, and AUM figures. Last updated September 2026.
What is the average yield of these ETFs?
The average distribution yield across the 12 ETFs on this list is 14.20%. Individual yields range from 5.69% to 29.47%.
What are JEPQ alternatives?
QQQI, GPIQ, and QYLD are the names people search as JEPQ alternatives. QQQI (NEOS) uses index options and often more tax-efficient distributions. GPIQ is Goldman's active Nasdaq-100 income peer. QYLD is the fully-covered, higher-headline-yield version with more capped upside.
What are the best JEPQ alternatives?
QQQI (NEOS) is the most-cited alternative — same Nasdaq-100 exposure with an index-options strategy and more tax-efficient distributions, often at a higher yield. GPIQ (Goldman Sachs) is another close active peer, while QYLD offers a higher yield via a fully-covered approach with more capped upside.
Which JEPQ alternative is most tax-efficient?
The NEOS fund QQQI is designed around tax efficiency, using index options (which can receive favorable 1256 treatment) and return-of-capital characterization to reduce the current tax drag on distributions. JEPQ's ELN-based income is generally taxed as ordinary income. Always confirm with your own tax advisor.
Do JEPQ alternatives all hold the same stocks?
Effectively yes — they all track or hold the Nasdaq-100, so they share heavy exposure to the same megacap technology names. That means stacking several of them diversifies the options strategy but not the underlying equity risk, which stays concentrated in big tech.
Explore more
Learn the method
The metrics and risks behind this list, explained in the Academy.
From the blog

Put this list to work in your portfolio
Import or build a portfolio to see income forecasts, upcoming distributions, income concentration, and risk across everything you own — and where a fund's yield and total return diverge.
7 days of Pro included · no credit card · free plan afterward