Best Of
Best Nasdaq-100 Income ETFs in 2026
Every ETF turning Nasdaq-100 volatility into income — from JEPQ's ELN approach to 0DTE funds, ranked by assets.
Data updated September 2026 · 25 ETFs
The short answer
This page ranks the 25 Nasdaq-100 income ETFs by assets, with distribution rates reaching 39.2% as of September 2026. Every one owns roughly the same thing — the megacap-heavy Nasdaq-100 — and sells options against it. What separates them is how much of the index's upside they sell away, and the yield column is essentially a price list for that trade-off.
The field sorts into four strategies. ELN funds (JEPQ, ROCQ) generate income through equity-linked notes and keep meaningful upside. Index-option funds (QQQI, XQQI, QQQH) write Nasdaq-100 index options, which can qualify for Section 1256 tax treatment. Systematic overwrites (QYLD, QYLG, QRMI) sell calls on the whole portfolio for a higher, steadier payout and the most capped upside. 0DTE funds (QDTE, QDTY, QQQY, QLDY) sell same-day options for weekly distributions and the largest headline rates — and carry the most NAV erosion risk. Because all four share one underlying index, stacking several diversifies the options strategy but not the equity risk.
Who this page is for
Best for
- Investors who want Nasdaq exposure to pay a monthly or weekly income stream
- Income portfolios that already hold an S&P 500 covered-call fund and want tech-sector premium alongside it
- Anyone comparing Nasdaq option-income methodologies before choosing between JEPQ, QQQI, GPIQ, and the newer entrants
Not a fit for
- Investors who want the Nasdaq's full growth — every fund here sells upside to fund the distribution
- Anyone seeking diversification; all 25 funds hold the same handful of megacap technology names
- Long-horizon accumulators, who have historically done better in QQQ itself than in a fund capping its gains
Analysis
The Nasdaq-100 income category exists because megacap technology stocks are volatile, and volatility is what option premium is priced on. Every fund on this list owns essentially the same index and differs only in how it converts that volatility into cash. JEPQ, the largest by a wide margin, uses equity-linked notes and writes options on only part of the portfolio, which keeps more of the Nasdaq's upside intact and helps explain why it has attracted more assets than the rest of the field combined. QQQI and its NEOS siblings write Nasdaq-100 index options, which can receive Section 1256 tax treatment and make distributions more tax-efficient in a taxable account. GPIQ, QQA, and BALQ are active partial overwriters positioned close to JEPQ. QYLD sits at the other end: a fully systematic covered-call program that sells calls against the entire portfolio, producing a high, dependable distribution and the most thoroughly capped upside — in a strong Nasdaq rally, it lags badly. The 0DTE cohort — QDTE, QDTY, QQQY, QLDY — sells same-day-expiry options for weekly payouts and headline rates in the 30-40% range; those rates are the newest and least battle-tested part of the category, and the distributions frequently include substantial return of capital. Read the yield column as a price list rather than a ranking: a higher rate on this page almost always means more of the index's growth has been sold away, so the comparison that matters is total return, not distribution rate.
Risks specific to this category
- Capped upside: covered-call and option-overlay funds in this group keep the option premium in a rally but surrender gains above the strike, so they can trail the very index they write options against.
- Distribution sustainability: the average distribution rate here is 15.0%, and payouts at that level often include return of capital — when distributions persistently exceed total return, NAV erodes and shrinks the base that generates future income.
- Single-index dependence: most funds here are built on the same Nasdaq-100 exposure, so they rise and fall together and share that index's concentration in its largest constituents — holding several of them does not diversify the underlying index risk.
- Expense drag: expense ratios in this group average 0.71% — several times what broad index funds charge — and that cost compounds directly against total return.
- Liquidity and closure risk: 9 of the 25 funds listed hold under $100M in assets, and small funds tend to trade with wider bid-ask spreads and face a higher risk of liquidation.
See this list inside your portfolio
A ranked list is a starting point. Dividend Vision turns it into a plan — forecasting the income your holdings actually generate and putting each fund's yield next to its total return and risk.
- Income forecasting — know what your holdings pay monthly, quarterly, and yearly
- Yield vs. total return — weigh each distribution against price performance, not the headline rate
- Screen & compare — line up any income ETFs side by side on yield, cost, and strategy
- Portfolio risk — see income concentration, issuer overlap, and volatility across your holdings
- AI ETF comparison — ask plain-language questions to compare yield, risk, and income potential
7 days of Pro included · no credit card · free plan afterward
Largest Nasdaq income ETFs
The three biggest Nasdaq-100 income ETFs by assets under management.
Yield distribution
Expense ratio distribution
Income projection
Estimated income if the current average distribution rate of 14.98% held for a full year with share prices unchanged. Distribution rate is not total return—a fund can pay a large distribution while its share price falls—so treat these as an upper-bound illustration, not a forecast.
| Investment | Annual income | Monthly income | Weekly income |
|---|---|---|---|
| $10,000 | $1,498 | $125 | $29 |
| $25,000 | $3,746 | $312 | $72 |
| $50,000 | $7,492 | $624 | $144 |
| $100,000 | $14,985 | $1,249 | $288 |
Distribution yield vs. total return
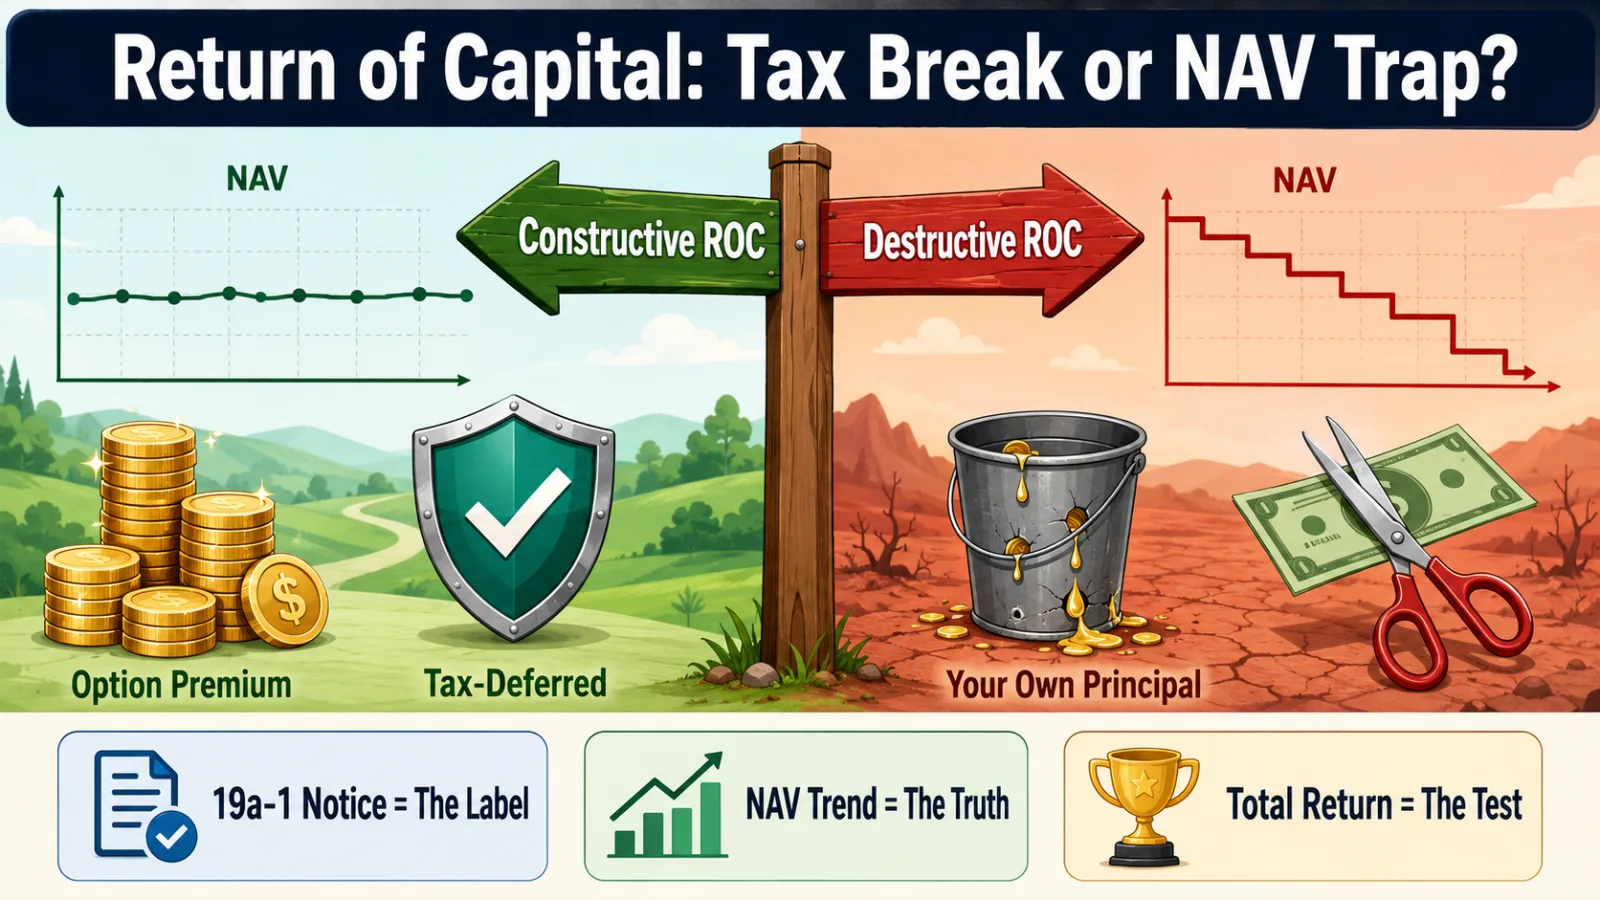
A high distribution rate is not the same as a high return. Your actual result is total return — the distributions you receive plus the change in the fund's share price. A fund can pay a large distribution while its price falls, and part of a distribution can be return of capital: your own money paid back to you, which lowers your cost basis rather than adding new profit. So a headline rate near 100% paired with a steep price decline can still leave a position underwater, which is why income is most meaningful read next to price performance rather than on its own.
Issuer breakdown
Distribution of ETFs by fund issuer, showing how concentrated or varied the sponsor lineup is.
How this list is built
This list is the Nasdaq-100 income category, not a filtered best-of:
- Every active ETF whose name identifies it as a Nasdaq-100 or QQQ fund and that distributes 4% or more qualifies, across all four option strategies
- Funds are ranked by assets under management, largest first — not by yield, which on this page mostly measures how much upside a fund has sold
- Leveraged and inverse products are excluded (their distributions are incidental), as are multi-asset blends and funds with no reported AUM
All 25 ETFs
| Ticker | Name | Issuer | Yield | Expense ratio | AUM | Frequency |
|---|---|---|---|---|---|---|
| JEPQ | JPMorgan Nasdaq Equity Premium Income ETF | JPMorgan | 13.60% | 0.35% | $42.8B | Monthly |
| QQQI | NEOS Nasdaq-100 High Income ETF | NEOS | 13.99% | 0.68% | $14.5B | Monthly |
| QYLD | Global X Nasdaq 100 Covered Call ETF | Global X | 11.83% | 0.60% | $8.3B | Monthly |
| GPIQ | Goldman Sachs Nasdaq-100 Core Premium Income ETF | Goldman Sachs | 10.48% | 0.29% | $5.7B | Monthly |
| FTQI | First Trust Nasdaq BuyWrite Income ETF | First Trust | 11.95% | 0.75% | $955M | Monthly |
| QDTE | Roundhill Innovation-100 0DTE Covered Call Strategy ETF | Roundhill Investments | 20.76% | 0.96% | $946M | Weekly |
| QQA | Invesco QQQ Income Advantage ETF | Invesco | 10.24% | 0.29% | $856M | Monthly |
| ROCQ | JPMorgan Nasdaq Equity Premium Yield ETF | JPMorgan | 10.59% | 0.35% | $629M | Monthly |
| IQQQ | ProShares Nasdaq-100 High Income ETF | ProShares | 5.69% | 0.55% | $398M | Monthly |
| QQQH | NEOS Nasdaq-100 Hedged Equity Income ETF | NEOS | 8.92% | 0.68% | $381M | Monthly |
| TDAQ | TappAlpha Innovation 100 Growth & Daily Income ETF | TappAlpha | 17.12% | 0.83% | $364M | Monthly |
| CAIQ | Calamos Nasdaq Autocallable Income ETF | Calamos Investments | 17.95% | 0.74% | $359M | Monthly |
| XQQI | NEOS Boosted Nasdaq-100 High Income ETF | NEOS | 20.52% | 0.98% | $329M | Monthly |
| QID | ProShares UltraShort QQQ | ProShares | 4.14% | 0.95% | $250M | Quarterly |
| QQQY | Defiance Nasdaq 100 Enhanced Income ETF | Defiance ETFs | 29.47% | 1.01% | $185M | Weekly |
| QYLG | Global X Nasdaq 100® Covered Call & Growth ETF | Global X | 6.85% | 0.35% | $172M | Monthly |
| QVOL | Infrastructure Capital Nasdaq Option Income ETF | InfraCap | 12.63% | 0.82% | $56M | Monthly |
| QLDY | Defiance Nasdaq 100 LightningSpread Income ETF | Defiance ETFs | 39.23% | 1.04% | $52M | Twice-Weekly |
| QQQT | Defiance Nasdaq-100 Target Income ETF | Defiance ETFs | 20.20% | 1.20% | $49M | Monthly |
| BALQ | iShares Nasdaq Premium Income Active ETF | iShares | 8.85% | 0.35% | $29M | Monthly |
| QDTY | YieldMax Nasdaq 100 0DTE Covered Call Strategy ETF | YieldMax | 25.92% | 1.17% | $27M | Weekly |
| QSIX | Pacer Metarus Nasdaq 100 Dividend Multiplier 600 ETF | Pacer | 4.31% | 0.60% | $19M | Monthly |
| QRMI | Global X Nasdaq 100 Risk Managed Income ETF | Global X | 12.04% | 0.60% | $15M | Monthly |
| EDGQ | Global X Nasdaq-100 Income Edge ETF | Global X | 12.85% | 0.50% | $12M | Weekly |
| TQQY | GraniteShares YieldBOOST QQQ ETF | GraniteShares | 24.49% | 1.15% | $6M | Weekly |
Frequently asked questions
What are the best nasdaq-100 income ETFs?
This page lists the top 25 ETFs in this category ranked by key metrics. The list includes funds from issuers like JPMorgan, NEOS, Global X, Goldman Sachs, First Trust and more.
How often is this list updated?
The data on this page is refreshed regularly using the latest available distribution rates, expense ratios, and AUM figures. Last updated September 2026.
What is the average yield of these ETFs?
The average distribution yield across the 25 ETFs on this list is 14.98%. Individual yields range from 4.14% to 39.23%.
What is the best Nasdaq-100 income ETF?
It depends on what you are optimizing for. JEPQ is the largest and keeps the most upside, making it the default choice for investors who still want growth. QQQI usually pays more and is structured for tax efficiency in taxable accounts. GPIQ is the low-cost active peer at 0.29%. QYLD pays a high, steady distribution but caps upside the hardest. There is no single winner — the funds are priced against each other on the upside-versus-income trade-off.
What's the difference between JEPQ and QQQI?
JEPQ (JPMorgan) generates income using equity-linked notes and writes options on part of the portfolio, so it retains more Nasdaq upside; its distributions are generally taxed as ordinary income. QQQI (NEOS) writes Nasdaq-100 index options, which can qualify for Section 1256 treatment and return-of-capital characterization, typically producing a higher and more tax-efficient distribution. Same index underneath, different income engine and different tax profile.
Why do the 0DTE funds yield so much more?
Funds like QDTE, QDTY, and QQQY sell options expiring the same day, collecting premium far more frequently than a monthly overwrite. That produces very large headline distribution rates, but the premium is compensation for giving up every daily move upward. These funds are also the newest in the category, so they have the shortest record of what that trade does to NAV over a full market cycle.
Can I own more than one Nasdaq income ETF?
You can, but understand what it does and does not diversify. Holding JEPQ alongside QQQI or GPIQ spreads you across different option methodologies and distribution schedules. It does not reduce your equity risk at all — every fund here holds the same megacap-heavy Nasdaq-100, so they fall together when big tech falls.
Should I just buy QQQ instead?
For a long-term growth account, often yes. Selling calls caps upside, and over extended bull runs in technology the plain index has generally outpaced the covered-call versions on total return. These funds make sense when you need the portfolio to produce spendable cash now, or when you want to reduce volatility and accept less growth in exchange. Compare total return, not distribution rate, when making that call.
Explore more
This is the whole category, JEPQ included. If you already hold JEPQ and are looking specifically for what to move into, the JEPQ alternatives page ranks its closest peers head-to-head instead.
Learn the method
The metrics and risks behind this list, explained in the Academy.
From the blog
Put this list to work in your portfolio
Import or build a portfolio to see income forecasts, upcoming distributions, income concentration, and risk across everything you own — and where a fund's yield and total return diverge.
7 days of Pro included · no credit card · free plan afterward