Dividend Vision Lists
Safest High-Yield Dividend Stocks
A curated list of high-yield dividend stocks yielding roughly 5% or more — energy midstream, REITs, telecom, tobacco, and BDCs — ranked not by headline yield but by our Distribution Safety Score, so the most durable payouts sit on top and the highest cut-risk names sink to the bottom.
Updated October 2026 · 35 companies
DV Scorecard
Our proprietary snapshot of this list — averages and standouts, computed from the companies below. Not investment advice.
A high yield is only as good as the dividend behind it — and the highest yields are often the market pricing in a coming cut. This page takes a curated set of high-yield dividend stocks, all yielding roughly 5% or more, and ranks them by our Distribution Safety Score rather than by headline yield, so the most durable payouts lead and the riskiest high-yielders fall to the bottom.
The list spans the sectors where high yields actually live: energy midstream and MLPs (Enterprise Products, Energy Transfer, MPLX), net-lease and healthcare REITs (Realty Income, STAG, Omega Healthcare), telecom and tobacco (Verizon, AT&T, Altria, British American Tobacco), and business development companies (Ares Capital, Main Street, FS KKR). Yields here range from around 5% to north of 20% — and that range is exactly the point, because a 20% yield with a weak safety score is a very different proposition from a 6% yield with a strong one.
This is the list only Dividend Vision can build: the same high-yield universe everyone screens for, re-sorted by the proprietary Distribution Safety Score™ so safety, not yield, decides the order. Every figure refreshes live from our data pipeline on every build, and nothing here is investment advice.
Safest High-Yield Dividend Stocks
Live data joins from our pipeline on every build — click any header to sort, or open a ticker for the full analysis. We never hard-code yields, prices, or returns.
| Ticker | Company | Role | Yield | Div growth (1y) | Distribution Safety Score™ | Fwd P/E | Market cap |
|---|---|---|---|---|---|---|---|
| VZ | Verizon Communications Inc. | Telecommunications | 6.32% | +3.5% | 100 | 8.7 | $186.1B |
| EPD | Enterprise Products Partners LP | Midstream Energy | 6.08% | +2.8% | 100 | 11.9 | $79.5B |
| ET | Energy Transfer LP | Midstream Energy | 6.71% | +3.1% | 100 | 12.0 | $69.8B |
| MPLX | MPLX LP | Midstream Energy | 7.41% | +12.5% | 100 | 12.2 | $59.0B |
| WES | Western Midstream Partners LP | Midstream Energy | 8.34% | +3.1% | 100 | 11.3 | $18.4B |
| PAA | Plains All American Pipeline LP | Midstream Energy | 6.61% | +9.9% | 100 | 13.1 | $17.8B |
| OHI | Omega Healthcare Investors | Diversified REIT | 5.96% | 0.0% | 100 | 10.1 | $13.8B |
| SUN | Sunoco LP | Fuel Distribution | 5.47% | +7.7% | 100 | 38.2 | $10.0B |
| USAC | USA Compression Partners LP | Midstream Energy | 8.23% | 0.0% | 100 | 16.9 | $3.7B |
| LTC | LTC Properties, Inc | Healthcare REIT | 5.22% | 0.0% | 100 | 12.5 | $2.4B |
| OKE | ONEOK Inc. | Energy | 4.59% | +3.9% | 99 | 14.5 | $58.8B |
| SBRA | Sabra Health Care REIT, Inc. | Equity | 6.20% | 0.0% | 99 | 32.2 | $4.9B |
| O | Realty Income Corporation | Net Lease REIT | 5.81% | +0.8% | 98 | 33.7 | $53.1B |
| NNN | NNN REIT, Inc. | Retail REIT | 5.97% | +3.5% | 98 | 20.4 | $8.0B |
| MO | Altria Group, Inc. | Tobacco | 5.91% | +3.9% | 97 | 11.9 | $125.4B |
| STAG | STAG Industrial | Diversified REIT | 4.33% | — | 94 | 144.9 | $6.9B |
| MAIN | Main Street Capital Corporation | BDC | 8.04% | +24.8% | 93 | 13.4 | $5.0B |
| CWEN | Clearway Energy, Inc. | Equity | 6.35% | +6.8% | 93 | 39.4 | $3.6B |
| ENB | Enbridge Inc. | Midstream Energy | 5.75% | +3.5% | 90 | 20.4 | $107.2B |
| ARCC | Ares Capital Corporation | BDC | 10.26% | 0.0% | 90 | 10.0 | $13.4B |
| WPC | W. P. Carey Inc. | Diversified REIT | 5.83% | +4.5% | 85 | 24.2 | $14.8B |
| BTI | British American Tobacco p.l.c. | Tobacco | 5.50% | +11.5% | 83 | 10.7 | $129.0B |
| VICI | VICI Properties | Diversified REIT | 7.80% | +3.9% | 82 | 7.8 | $26.0B |
| EPR | EPR Properties | Diversified REIT | 6.68% | +5.1% | 82 | 19.3 | $4.3B |
| HTGC | Hercules Capital, Inc. | BDC | 11.06% | -13.0% | 78 | 8.6 | $3.1B |
| AGNC | AGNC Investment Corp | Mortgage REIT | 16.51% | 0.0% | 64 | 6.6 | $10.3B |
| T | AT&T Inc. | Telecommunications | 4.74% | 0.0% | 63 | 9.9 | $160.6B |
| IIPR | Innovative Industrial Properties, Inc. | Equity | 14.51% | 0.0% | 63 | 12.4 | $1.4B |
| AB | AllianceBernstein Holding L.P. | Equity | 9.41% | +5.8% | 61 | 9.4 | $3.2B |
| DOC | Healthpeak Properties Inc. | Real Estate | 6.45% | 0.0% | 59 | 169.5 | $13.1B |
| OBDC | Blue Owl Capital Corporation | BDC | 13.65% | — | 56 | 8.3 | $5.0B |
| LYB | LyondellBasell Industries N.V. | Chemicals | 4.31% | -49.1% | 49 | 9.1 | $20.7B |
| DOW | Dow Inc. | Chemicals | 4.68% | -50.0% | 43 | 14.1 | $21.6B |
| ABR | Arbor Realty Trust, Inc. | Mortgage REIT | 25.28% | -36.8% | 6 | 11.7 | $502M |
| FSK | FS KKR Capital Corp. | BDC | 19.75% | -34.3% | 0 | 7.9 | $2.9B |
Why this list matters
High yield and safety usually pull in opposite directions. Ranking by our Distribution Safety Score instead of yield surfaces the rare names that offer real income without the highest cut risk — and makes the dangerous high-yielders obvious.
Who it's for
- Income investors who want high current yield but are wary of dividend cuts
- Retirees weighing payout durability against headline yield
- Anyone who has been burned by a yield trap and wants a safety-first view
- Investors comparing a high-yielder they own against safer peers at similar yields
Benefits
- Current income well above the market average, from 5% to 20%+
- A safety-ranked layout that puts the most durable payouts first
- Exposure across midstream energy, REITs, telecom, tobacco, and BDCs in one view
Risks
- High yields often signal elevated risk — the highest-yielding names here carry real cut risk
- Interest-rate sensitivity across REITs, BDCs, and midstream partnerships
- Sector concentration risk if you buy several names from the same corner of the market
- MLPs and some BDCs use leverage and complex structures, and issue K-1 tax forms
- A Distribution Safety Score is a data-driven estimate, not a guarantee — payouts can still be cut
What to watch
- The Distribution Safety Score first, then the yield — a lower yield with a higher score is often the better risk-adjusted income
- Payout ratio and coverage, especially on the highest-yielding names
- The business structure: a net-lease REIT and a leveraged BDC paying similar yields carry very different risk
- Whether a very high yield reflects strength or a falling price pricing in a cut
How we rank these investments
Unlike most of our lists, this page ships pre-sorted: by default it ranks every name by our Distribution Safety Score, safest first, rather than by yield. You can still re-sort on any column — these are the dimensions we surface.
- Distribution Safety Score. Our proprietary read on how durable a payout looks, from the same one scorer used across the site. This is the DEFAULT sort here, so the safest high-yielders lead and the riskiest sink to the bottom.
- Distribution yield. The current dividend as a share of price. Every name here yields roughly 5%+, but a higher yield is not automatically better — pair it with the Distribution Safety Score.
- Dividend growth. How fast the payout is rising, flat, or falling — a falling or frozen dividend is an early warning the Distribution Safety Score also reflects.
- Business role. Midstream/MLP, REIT, telecom, tobacco, or BDC — the single biggest driver of how safe a similar-looking yield really is.
- Valuation. Forward P/E and related measures put the price in context, though REITs and MLPs are better judged on cash-flow metrics shown on each ticker page.
- Total return. Price change plus dividends. A rich distribution can mask weak or negative price performance, so total return is the honest scorecard.
- Liquidity & size. Market capitalization and trading volume. Larger, more liquid names tend to be less volatile.
- Payout ratio. The share of earnings (or cash flow) paid as dividends — a core coverage check behind the Distribution Safety Score.
Frequently asked questions
What are the safest high-yield dividend stocks?
There is no risk-free high yield, but this page ranks a curated set of 35 high-yield stocks (5%+) by our Distribution Safety Score, so the most durable payouts appear at the top. Safety is a data-driven estimate, not a guarantee — always do your own research.
How is this list different from a plain high-yield screen?
A normal high-yield screen sorts by yield, which pushes the riskiest, most cut-prone names to the top. This page instead sorts by our Distribution Safety Score, so a durable 6% payer can outrank a shaky 15% one. Same universe, safety-first order — the view only Dividend Vision can build.
Is a higher dividend yield always better?
No. A very high yield is often the market pricing in a dividend cut — a classic yield trap. That's why we lead with the Distribution Safety Score: the goal is the best risk-adjusted income, not the biggest headline number. Sort by score to see how the group really stacks up.
Why are so many high-yield stocks REITs, MLPs, and BDCs?
These structures are required (or built) to pay out most of their income — REITs distribute rental income, MLPs distribute pipeline cash flow, and BDCs distribute loan interest — which naturally produces high yields. It also means their payouts move with rents, energy volumes, and credit conditions.
What yield qualifies as high?
This page uses roughly 5% or more as the floor, well above the broad market's ~1–2%. The range runs from around 5% on the steadier names to over 20% on the highest-risk ones — which is why ranking by safety matters so much.
Can a stock with a high Distribution Safety Score still cut its dividend?
Yes. The Distribution Safety Score is a data-driven estimate of durability, not a promise. A high score means the payout looks well-covered today; it can't rule out a future cut from a shock to the business. Treat it as a starting filter, then verify each name.
What is the Distribution Safety Score?
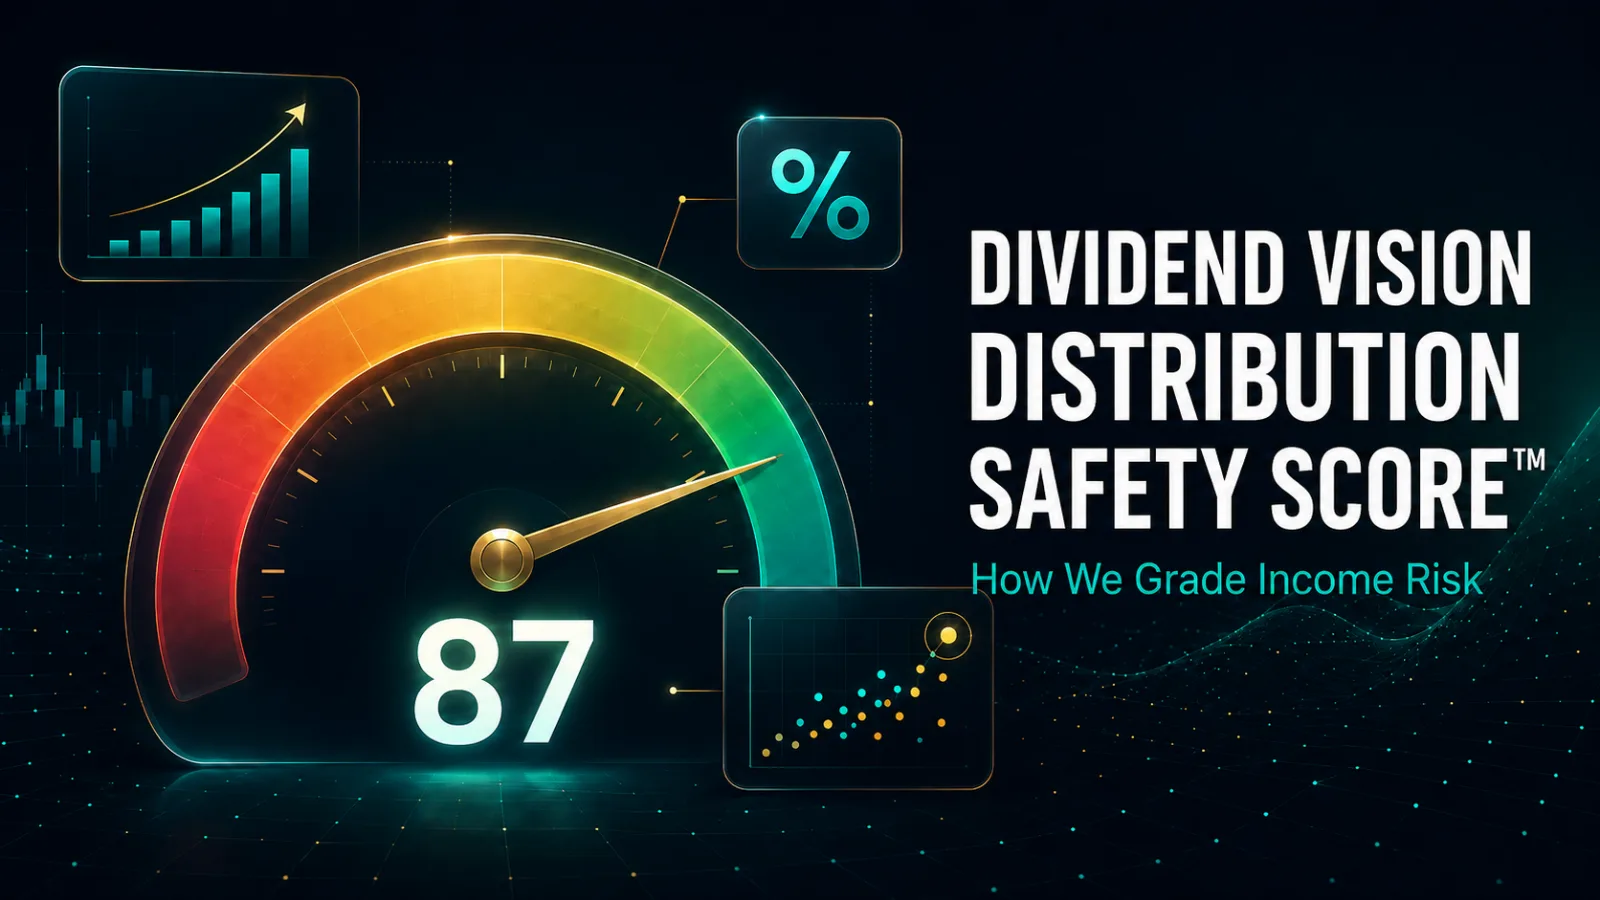
It's Dividend Vision's proprietary measure of how durable a company's dividend looks, scored from 0 to 100 using the same single model applied across the site — the same score that powers this page's default ranking.
How often is this list updated?
The membership is curated, while yields, prices, market caps, and Distribution Safety Score readings refresh from our data pipeline on every build. The ranking re-sorts automatically as scores change, so the figures reflect the most recent data run.
Related lists


Related tools
Take any name on this list further with Dividend Vision's free tools.
Learn the method
The metrics and risks behind this list, explained in the Academy.